Variant Report
Variant calling pipelines contains two exclusive sections.
Mapping
This section provides details of the abundance/mapping statistics. This section also has three sub-sections:This
-
-
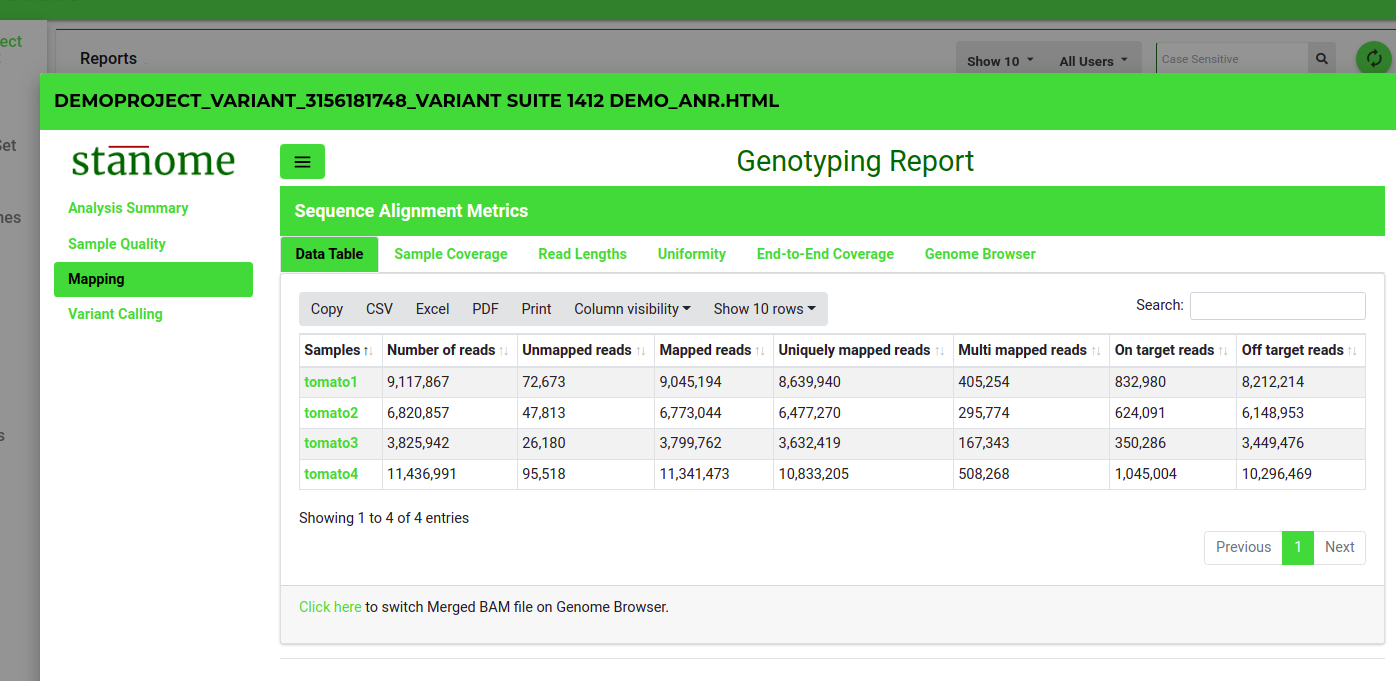
- Data Table: This (Fig. 1) shows several alignment statistics such as the number of total processed reads, the number of mapped or multi-mapped reads, and the uniquely mapped reads.
- Sample Coverage: Allows users to explore the alignment quality through a series of plots. Sample depth of coverage in total read counts. Sample depth of coverage in percentages. On-target mapping quality in a 96-well plate format
- Read Lengths: Histograms and 96-well plate plots show the read length distributions for mapped and unmapped reads.
- Genome Browser: Aligned reads against the reference genome can be viewed for each sample. The genome browser is interactive and allows exploratory analysis.
-
Variant Calling
This section provides details of the abundance/mapping statistics. This section also has three sub-sections:
-
-
-
- Call Rate Summary: Provides a summary of the genotype calls.
- Target Call Rates: Genotype calling metrics for the top 100 targets are shown in the table format. The complete list can be downloaded from the Reports section. The position field is cross-linked to the Variant Browser. This section also shows:
- Genotype call distribution
- Genotype Heatmap
- Sample Call Rates: Histograms and 96-well plate plots show the call rate distributions from all the samples.
- Genotypes: Shows table of genotypes obtained for each marker across all the samples
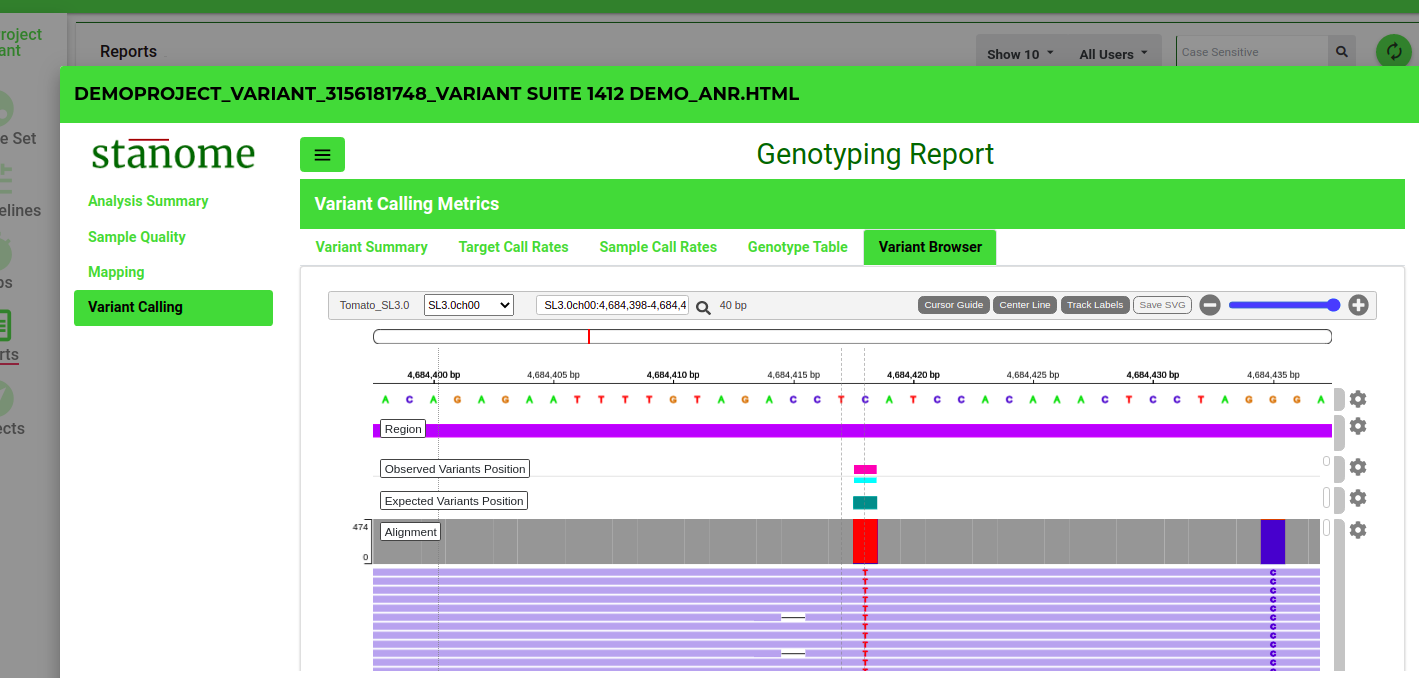
- Variant Browser: Sequencing reads support for each variant can be viewed for each sample (Fig. 2). The genome browser is interactive and allows exploratory analysis.
-
-